


A Republican for governor and a Democrat for the U.S. Senate, both on the same ballot? Voters can do that. Are your students curious about what goes into those decisions?
It’s called split-ticket voting, and it gives us an interesting way to look beyond who won an election. What might lead someone to choose candidates from different parties, and what can the evidence actually tell us?
Coming Soon: Split-Ticket Voting in the 2026 Midterms
Check back after the 2026 midterm elections for examples of split-ticket voting as results and analysis become available.
Before You Teach
The following report includes campaign advertisements and discussion of candidates’ positions on reproductive health policy. Preview it for your classroom. Keep discussion focused on how voters weigh candidates and issues, and respect students’ privacy about their families’ political choices.
Watch: Why Voters Split Their Tickets
In this PBS NewsHour report, two Maryland voters explain how they’re weighing their choices for the U.S. Senate. Listen for why someone might support a candidate for governor but make a different choice when that candidate later runs for the Senate.
The 5:49 minute segment aired Sept. 20, 2024, so references to upcoming races and control of the Senate describe that election cycle. Closed captions and a transcript are available on the PBS video page.
Discussion Questions
- What makes Colin Pascal’s intended choices an example of split-ticket voting?
- Why does Pier Blake view supporting Hogan for Senate differently from supporting him for governor?
- What additional evidence would help you determine how common these voters’ choices are?
Media Literacy Challenge: From Interviews to Evidence
An interview can explain one person’s reasoning. To investigate a broader pattern, we need evidence covering more voters.
The MIT Election Data and Science Lab explains why separate candidate totals cannot reveal exactly how many voters split their tickets. Voters can cross party lines in either direction or leave a contest blank.
Use the Yale Ticket Splitting Visualizer to compare these two contests from Georgia’s 2020 general election:
- President of the United States, featuring Joe Biden and Donald Trump.
- The regular U.S. Senate contest, featuring Jon Ossoff and David Perdue. Choose this contest rather than the separate special Senate election.
Teacher Setup: On the search page, select the “Compare” checkbox for each contest and choose “Visualize.” Put presidential choices in the rows and Senate choices in the columns. Display row percentages and project the table. Each row answers a question such as, “Among these Biden voters, what percentage supported each Senate candidate?”
Ask students to locate Biden-Perdue and Trump-Ossoff choices. Each pairs a Democrat with a Republican on the same ballot. Then discuss:
- What does the table show that separate totals for each candidate would leave out?
- What additional evidence would help explain these voters’ reasons?
Source Check: Yale’s project explanation says the tool covers 89 of Georgia’s 159 counties and is not representative of the entire state. Limit conclusions to the included records. A voting pattern alone does not establish someone’s party identity, ideology, or motivation.
Pizza vs. Tacos: A House Divided Over Dinner
Imagine a town where the Pizza Party and Taco Party are competing for governor and U.S. Senate. In this fictional election, 100 voters each choose one candidate in both races. They can support the same party twice or choose a different party for each office.
The Pizza Party receives 50 votes for governor and 60 for Senate. A reporter sees only those totals and writes the headline below.
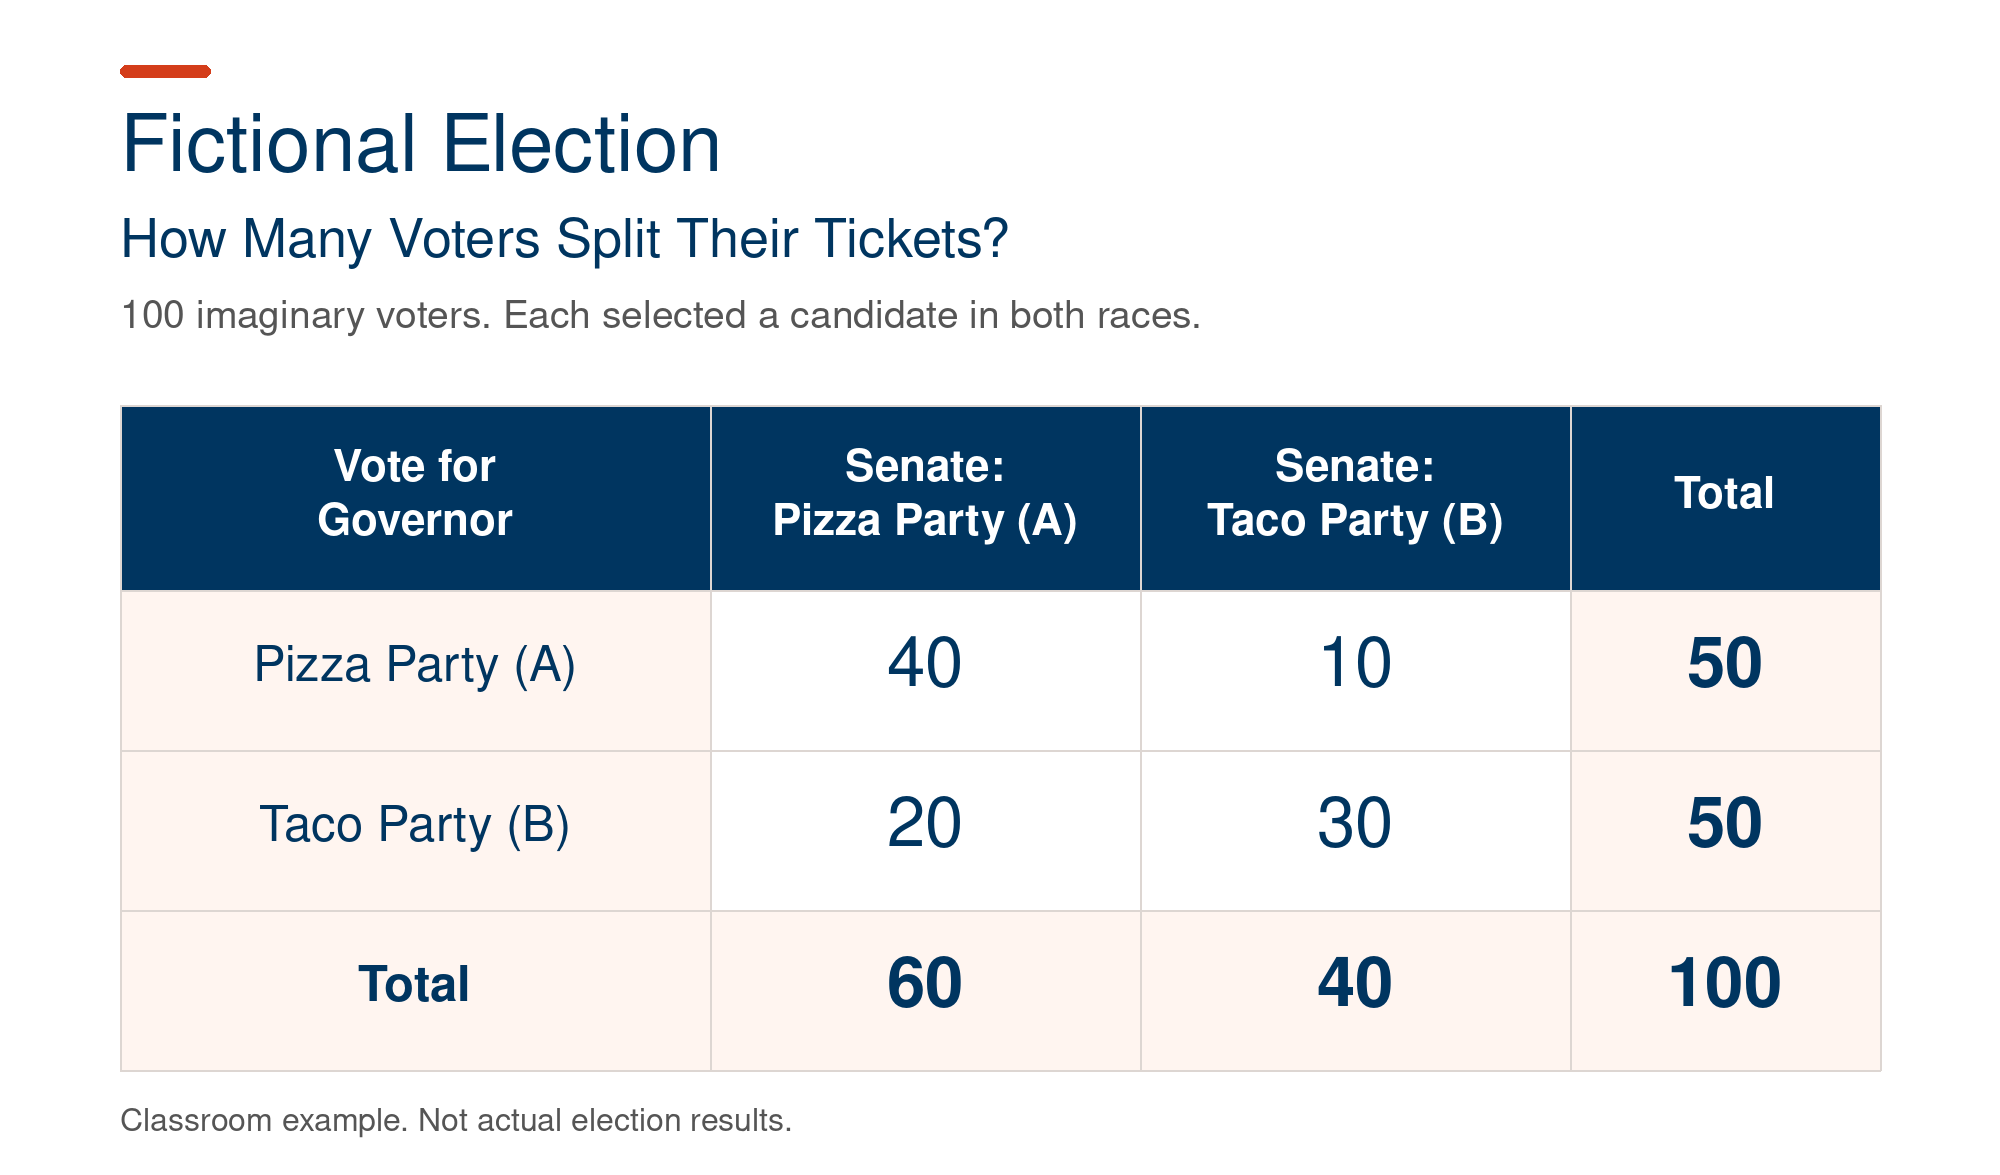
Investigate: Read the headline, then examine the chart showing how those same 100 people voted. Does the evidence support the headline’s claim? Explain your reasoning.

Teacher Answer: How to Read the Chart
The rows show voters’ choices for governor; the columns show their choices for Senate. Each number in the middle of the chart counts people who made that combination of choices. Each voter is counted once. The totals along the right and bottom summarize those same 100 voters; they are not additional people. Read across each row:
- 40 voters chose the Pizza Party for both governor and Senate.
- 10 voters chose the Pizza Party for governor and the Taco Party for Senate.
- 20 voters chose the Taco Party for governor and the Pizza Party for Senate.
- 30 voters chose the Taco Party for both offices.
The 10 and 20 are the split-ticket voters, because they selected different parties across the two races. Together, that’s 30 voters. The other 70 chose the same party for both offices.
Why the Headline Is Incorrect: Ticket-splitting goes both ways. Twenty voters chose Taco for governor and Pizza for Senate, while 10 chose the reverse. Those choices produce a difference of 20 − 10 = 10 votes, but the number of people who split their tickets is 20 + 10 = 30. Separate candidate totals hide those two groups.
Another Way to Explain It: Imagine 20 students enter a classroom and 10 other students leave. The classroom has 10 more students, but 30 students passed through the doorway. Similarly, the difference between candidate totals does not count everyone who split their ticket.
Optional Math Challenge: Could these same totals come from 90 split-ticket voters? Try rearranging the four groups while keeping the totals for each party in each race unchanged.
Teacher Key: Yes. Ten voters choose Pizza for both offices; 40 choose Pizza for governor and Taco for Senate; 50 choose Taco for governor and Pizza for Senate; and none choose Taco for both offices. The governor totals remain Pizza 50 and Taco 50, and the Senate totals remain Pizza 60 and Taco 40. This time, 40 + 50 = 90 voters split their tickets.
Review With the Interactive Quiz
Work through the interactive quiz below to revisit the voting combinations. As you explore, practice explaining why a difference of 10 votes can conceal 30 split-ticket voters.
Loading the lab…
Optional Extension: How Reporters Find Voters
Watch 2:20–3:10 of “Split Voters in the Spotlight Ahead of the Midterms.” an Oct. 23, 2026, report from 11Alive, Atlanta’s NBC affiliate.
In this approximately 50-second excerpt, the reporter describes searching for split-ticket voters and finding an interview subject. Stop at 3:10, before the interview begins.
Discuss: Why can’t the difficulty of finding an interview subject tell us how common split-ticket voting is?
- Teacher Note: This report describes intended choices before the 2026 election. A reporter’s search is not a representative survey.
2026 Election Lesson Plans and Resources
Explore our election resources to engage your students in learning about the election process and its significance at every level. Discover lessons on election fundamentals, laws, security, current events, youth involvement, and historic U.S. elections.

Andy Kratochvil is a proud member of the AFT Share My Lesson team, where he’s passionate about discovering and sharing top-tier content with educators across the country. He earned his bachelor’s degree in political science and French from California State University, Fullerton, and later completed... See More
Advertisement


